Blog Content
🌍Introduction
In today's digital world, organizations are constantly generating vast amounts of data - from user interactions and financial transactions to system logs and third-party integrations. However, raw data on its own holds little value unless it is properly processed, organized, and transformed into meaningful insights.
As businesses grow, managing this data manually becomes impossible. Data is often scattered across multiple systems, arrives in different formats, and needs to be processed quickly to support real-time decision-making. Without an efficient system in place, organizations risk delays, inconsistencies, and missed opportunities.
This is where data pipelines come into play. Data pipelines act as the backbone of modern data systems, enabling organizations to automatically collect, process, and deliver data in a reliable and scalable way. They ensure that the right data is available at the right time, empowering businesses to make faster, smarter, and data-driven decisions.
What is Data Pipeline
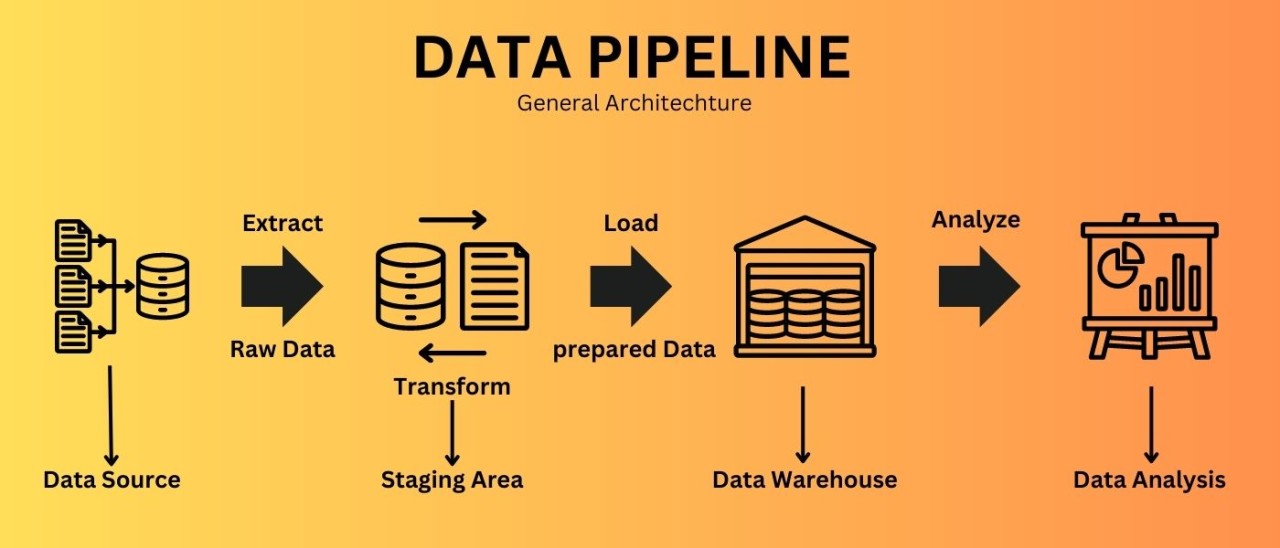
A Data Pipeline is an automated system that collects data from multiple sources, processes it by cleaning and transforming, and then loads it into a destination system for analysis or business use.
Typically, it follows a flow like source -> ingestion -> processing (ETL/ELT) -> storage -> consumption.
For example, in an e-commerce system:
- User orders are captured in a database
- A data pipeline processes this data to calculate metrics such as revenue and sales trends
- The processed data is stored in a data warehouse
- Dashboards provide insights to the business team
Types of Data Pipeline
- Batch Processing pipelines
- Streaming data pipelines
- Data integration pipelines
- Cloud-native pipelines
Data pipeline Architecture

Data pipeline architecture is the overall design or blueprint that defines how data is collected, organized, processed, stored, and used within a system or organization.
Why do we need Data pipelines?
In the early days, businesses handled small amounts of data using simple tools like spreadsheets and basic database. Data was limited, easy to manage, and could be processed manually. However, with the growth of technology - such as mobile applications, e-commerce platforms, social media, and IoT devices - the amount of data increased rapidly.
As data volume grew, traditional methods started failing. Manual processing became slow and error-prone, data was scattered across multiple systems, and businesses were unable to make quick decisions. Handling large-scale and real-time data using old approaches became almost impossible.
This led to the emergence of data pipelines as a critical solution for managing large-scale data.
Data pipelines were introduced to automate the process of collecting, processing, and moving data from different sources to a destination system. They ensure that data is clean, consistent, and available in real time or at scheduled intervals for analysis.
Today, data pipelines are essential because they:
- Handle large volumes of data efficiently
- Enable real-time and faster decision-making
- Reduce manual work and errors
- Integrate data from multiple sources
- Support analytics, reporting, ad AI systems
In simple words:
As data grew bigger and faster, businesses needed automated systems to manage it - and that led to the need for data pipelines.
Data Ingestion
Data ingestion is the process of collecting data from different sources - such as databases, APIs, applications, or files - and bringing it into a system where it can be stored and processed. It is the first step in any data pipeline because it allows raw data to enter the system for further analysis. For example, when users place orders on an e-commerce website, that data is captured and transferred to a storage system like a database or data warehouse - this process is called data ingestion. It can happen in batches (at scheduled intervals) or in real time (as data is generated), depending on the use case.
Data Transformation
Data transformation happens after data ingestion in a data pipeline. Once raw data is collected from different sources, it is often incomplete, inconsistent, or in different formats. During transformation, this data is cleaned by removing errors or duplicates, handling missing values, and converting it into a structured format. It may also involve combining data from multiple sources, filtering unnecessary information, and performing calculations like totals or averages. For example, if sales data comes in JSON format, transformation can convert it into a table with columns like product, price, and quantity, making it easier to analyze.
Key Tasks:
- Data cleaning
- Data formatting
- Data integration
- Data aggregation
Data Storage
After data is collected (ingestion) and cleaned or processed (transformation), it needs to be stored in a proper system so it can be used whenever required. This step is called data storage. The stored data can be in raw form or structured form depending on the system. For example, a company may store raw data in a data lake and processed data in a data warehouse. This allows analysts, dashboards, and applications to access the data easily for reporting and decision-making. Good data storage ensures that data is secure, organized, and quickly accessible.
Tools & Technologies in Data Pipelines
Data Ingestion Tools :- Apache kafka, AWS Kinesis, Apache NiFi
Data Processing Tools :- Apache Spark, PySpark, Apache Flink
Orchestration Tools :- Apache Airflow, AWS Glue
Data Storage Technologies :- Amazon S3, Amazon Redshift, Snowflake, PostgreSQL
Data Visualization Tools :- Power BI, Tableau
Cloud Platforms :- Amazon Web Services, Microsoft Azure, Google Cloud Platform
Batch vs Real-Time Pipelines

Data Storage Strategies
Data storage strategies define how data is stored, organized, and managed within a data pipeline to ensure it is secure, scalable, and easily accessible for analysis. Organizations use different approaches depending on their needs. For example, a data lake is used to store raw data in its original format, making it flexible and cost-effective for large-scale data and machine learning use cases. A data warehouse, on the other hand, stores clean and structured data optimized for reporting and analytics. Modern systems often use a data lakehouse, which combines the benefits of both. Another common approach is the layered strategy (Bronze, Silver, Gold), where raw data is first stored, then cleaned, and finally transformed into business-ready data. Additionally, data can be stored based on usage frequency using hot, warm, and cold storage to balance performance and cost. Overall, a good data storage strategy ensures that data is well-organized, reliable, and ready for efficient analysis and decision-making.

Data Quality & Governance
Data Quality and Governance are essential components of a data pipelines that ensure data is accurate, consistent, secure, and reliable. Data quality focuses on maintaining the correctness of data by removing errors, handling missing values, and ensuring consistency across different sources. On the other hand, data governance refers to the rules, policies, and processes used to manage and control data throughout its lifecycle, including access control, data privacy, and compliance. Together, they help organizations trust their data, make better decisions, and avoid issues such as incorrect reporting or data misuse. In modern data systems, strong data quality and governance practices are critical for maintaining data integrity and supporting analytics, reporting, and AI applications.
Monitoring & Debugging Pipelines
Monitoring and Debugging Pipelines are critical practices that ensure a data pipeline runs smoothly, efficiently, and without failures. Monitoring involves continuously tracking the performance of the pipeline - such as data flow, job status, execution time, and error rates - to quickly detect any issues. Debugging, on the other hand, is the process of identifying, analyzing, and fixing those issues when they occur. In real-world systems, pipelines can fail due to data quality problems, schema changes, system errors, or delays in upstream data. Proper monitoring and debugging help teams detect failures early, reduce downtime, and maintain reliable data delivery. Tools like Apache Airflow, logging systems, and alerting mechanisms are commonly used to track and manage pipeline health. Overall, strong monitoring and debugging practices ensure that data pipelines remain stable, accurate, and trustworthy for business use.
Scaling Data Pipelines
Scaling Data Pipelines refers to the ability of a pipeline to handle increasing volumes of data, more users, and higher processing demands without affecting performance. As businesses grow, the amount of data generated also increases, making it essential for pipelines to scale efficiently. This can be achieved through techniques like distributed processing, parallel execution, and using cloud-based services that automatically adjust resources based on workload. For example, tools like Apache Spark allow large datasets to be processed across multiple machines, improving speed and efficiency. Scaling also involves optimizing data storage, managing workloads, and ensuring fault tolerance so that the system remains reliable even under heavy load. Overall, scalable data pipelines ensure consistent performance, faster processing, and the ability to support growing business needs.
Turning Data into Business Insights
Turning Data into Business Insights is the final and most valuable stage of a data pipeline, where processed data is converted into meaningful information that helps organizations make better decisions. After data is collected, cleaned, and stored, it is analyzed using tools like dashboards, reports, and analytics platforms to uncover patterns, trends, and key metrics. For example, businesses can track sales performance, customer behavior, or operational efficiency to identify opportunities and solve problems. Visualization tools such as Power BI and Tableau help present this data in an easy-to-understand format. By transforming raw data into actionable insights, organizations can improve decision-making, increase efficiency, and gain a competitive advantage.
Common Challenges & Pitfalls
Data pipelines often face several challenges when handling large and complex data. One of the most common issues is maintaining data quality, as missing, duplicate, or inconsistent data can lead to incorrect insights. Scalability is another challenge, where pipelines struggle to handle increasing data volumes efficiently. Pipeline failures due to system errors, dependency issues, or schema changes can disrupt the flow of data. Additionally, lack of proper monitoring makes it difficult to detect and fix problems quickly. Managing real-time data latency and controlling infrastructure costs are also major concerns. Without proper planning and design, these challenges can reduce the reliability and effectiveness of data pipelines.
Data Quality Issues
- Missing or incorrect data
- Duplicate records
- Inconsistent formats
Scalability Problems
- Difficulty handling large data volumes
- Performance drops with increasing load
Pipeline Failures
- Job failures due to system or network issues
- Dependency failures between tasks
Schema Changes
- Changes in data structure break pipelines
- Requires constant updates and maintenance
Lack of Monitoring
- No proper alerts or tracking
- Failures detected too late
High Latency
- Delay in real-time data processing
- Slow data availability for decision-making
Data Silos
- Data stored in isolated systems
- Difficult to integrate and analyze
Security & Compliance Issues
- Unauthorized data access
- Lack of proper data governance
Complex Debugging
- Hard to identify root cause of failures
- Multiple systems involved
Cost Management
- High infrastructure and cloud costs
- Inefficient resource usage
Best Practices
To build efficient and reliable data pipelines, it is important to follow certain best practices. Ensuring data quality through validation and cleaning is essential for accurate results. Pipelines should be designed for scalability so they can handle growing data volumes without performance issues. Automation using tools like Apache Airflow helps manual effort and improves consistency. Proper monitoring and alerting systems should be in place to quickly detect failures. Using a modular architecture and implementing strong security and governance practices ensures long-term reliability and compliance.
Ensure Data Quality
- Validate data during ingestion
- Handle missing and duplicate values
- Maintain consistent formats
Design for Scalability
- Use distributed systems
- Plan for increasing data volume
- Avoidj bottlenecks
Automate Workflows
- Schedule pipelines using tools like Apache Airflow
- Reduce manual intervention
- Ensure repeatability
Implement Monitoring & Alerts
- Track pipeline performance
- Set up alerts for failures
- Log errors for debugging
Use Modular Architecture
- Break pipelines into smaller components
- Make systems easier to maintain and update
Store Raw Data
- Keep original data for reprocessing
- Helps in debugging and recovery
Optimize Performance
- Use efficient queries and indexing
- Process data in parallel when possible
Handle Schema Changes
- Use schema versioning
- Build flexible pipelines
Ensure Security & Governance
- Control data access
- Follow data privacy rules
- Encrypt sensitive data
Choose the Right Tools
- Use appropriate tools for each stage
- Example: Ingestion (Kafka) , Processing (Spark) , Storage (S3 / Warehouse)
Future Trends
The future of data pipelines is moving towards more advanced, automated, and real-time systems. Organizations are increasingly adopting real-time processing to gain instant insights. Cloud-native pipelines and serverless technologies are becoming more popular due to their scalability and cost efficiency. There is also a shift from traditional ETL or ELT approaches, especially with modern data warehouses. Data lakehouse architecture is emerging as a powerful solution that combines the benefits of data lakes and warehouses. Additionally, integration of AI and machine learning is enabling smarter pipelines with automated data quality checks and anomaly detection. Overall, future data pipelines will be faster, more intelligent, and highly scalable to meet growing data demands.
Shift to Real-Time Processing
- Increasing demand for instant insights
- More adoption of streaming pipelines (low latency)
Rise of Cloud-Native Pipelines
- Use of scalable cloud platforms
- Serverless and managed services becoming standard
Adoption of ELT over ETL
- Data is loaded first, then transformed
- Better suited for modern data warehouses
Data Lakehouse Architecture
- Combines data lakes and warehouses
- Supports both analytics and machine learning
AI & Machine Learning Integration
- Automated data cleaning and anomaly detection
- Smarter pipelines with predictive capabilities
DataOps Practices
- Focus on automation, monitoring, and collaboration
- Faster and more reliable pipeline development
Increased Focus on Data Governance
- Stronger data privacy and compliance requirements
- Better control over data access and usage
Edge Data Processing
- Processing data closer to the source (IoT, devices)
- Reduces latency and bandwidth usage
Low-Code / No-Code Tools
- Easier pipeline creation without heavy coding
- Faster development for non-technical users
Cost Optimization Strategies
- Efficient resource usage in cloud environments
- Pay-as-you-go models and auto-scaling
Conclusion
Data pipelines have become a fundamental part of modern data systems, enabling organizations to efficiently collect, process, store, and analyze large volumes of data. From data ingestion to transformation, storage, and finally generating business insights, each stage plays a crucial role in turning raw data into meaningful information.
As data continues to grow in volume and complexity, the importance of scalable, reliable, and well-designed data pipelines will only increase. By following best practices, using the right tools, and focusing on data quality and governance, businesses can build strong pipelines that support faster decision-making and long-term growth.
Transform Your Digital Presence
With Expert Engineering
We build high-performance web applications, mobile apps, and AI-driven systems. Let's discuss how we can help you achieve measurable growth.